The process of turning data insights into something actionable is often more complicated than it seems. The mortgage industry collects an astonishing amount of data, and while we’re great at analysing it, our ability to turn that analysis into tangible change for customers sometimes falls short of its potential.
Customer insights need to inform each step of the value chain to set the standard for customer journeys. Data-driven decision-making is the way forward. With the Consumer Duty deadline fast approaching, we’re doubling down on our efforts to help firms turn data insights into tangible benefits for customers.
Why it's Important - A Small Case Study
When analysed properly, data can tell you a million things you didn’t already know about your customers. The stories emerging from the numbers often take us by surprise and go against what we intuitively or anecdotally believe to be true.
Here’s a real example:
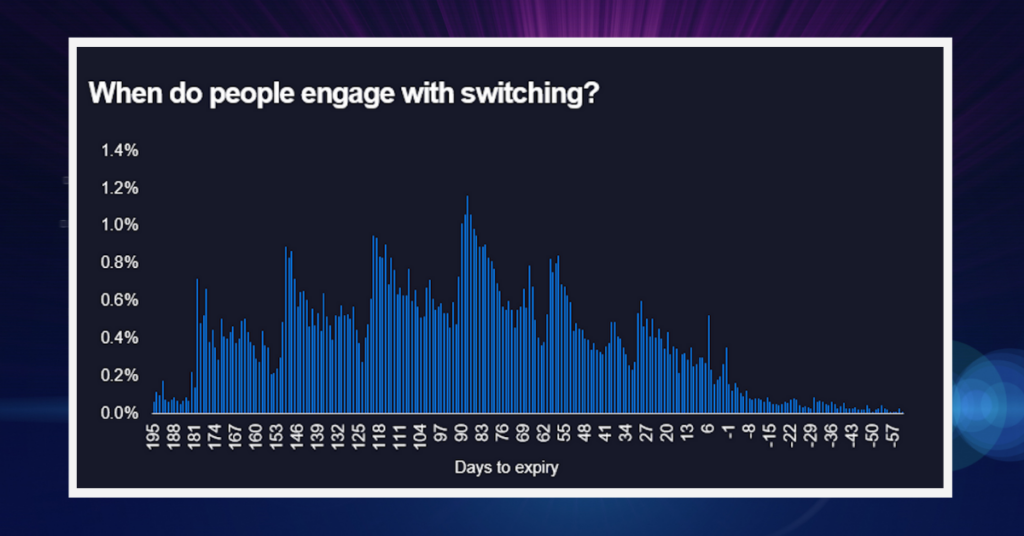
Situation/problem: While planning the customer journey for product transfer options, lender stakeholders were unable to agree on when to send the first communications about switching. Historically, the lender had engaged with customers around 3 months ahead of their current deal’s expiry date.
The data: With aggregated data of 1 million mortgage customers using the Eligible platform, we were able to provide some insight into customer behaviour around switching:
The data indicated that many customers are actually ready to engage with switching up to 6 months ahead.
The Solution: With this information, the lender felt confident adjusting the switching window, bringing communication forward in the customer journey to help with the process.
The numbers don’t lie – even if they surprise us. This is a great example data-driven decision making and turning insights into action.
Insights into Action: The Challenges
Large quantities of existing data are isolated and stored in separate systems, which makes it challenging for financial institutions to access and compare different data streams. UK Finance describes the industry as “digitally fragmented,” lacking in standard practice and limited in visibility.
Data analysis across complex systems with differing compliance requirements and applications can often result in an incomplete view of the customer journey. Figuring out what data is available, where to access it, and how to process it is challenge number 1. It can feel like an overwhelming task, but implementing a data-first culture where reports are accessible and in a consistent format will help your data tell the story it needs to.
Important Tasks:
Establish a robust data architecture
Embed data discovery and utilisation into your company culture
Hold focus groups with your teams to understand what data you need and where you can collect it
Decide how you will derive meaning from the data and who will be responsible for objectively reviewing it
So, you have your data, and you’ve noticed some interesting trends appearing – how are you going to communicate what you’ve found and action it for the benefit of your customers?
Insights into Action: A Checklist
Here are some key ways you can utilise data to add real value to your customer experiences and outcomes:
Active listening:
Observing consumer behaviour in real-time ensures that behaviour cannot go unnoticed and unanalysed. Through an active-listening approach, financial institutions can understand the changes customers would like to see.
Tip:Adopting consumer platforms allows for centralised customer data. Consolidating customer data completes the customer profile, especially when you combine it with financial and behavioural data to inform your next steps.
Clean up existing data and monitor access:
Comb through data. Any data elements that cannot be fixed should be removed, particularly where it is unstructured. This will streamline processes and ensure that more time is spent on valuable data. Good data hygiene is imperative to meaningful insights. Additionally, access to all data for employees should be monitored and removed when necessary.
Identifying gaps and opportunities:
Observing audience insights showcases opportunities and holes in the market. By analysing what is working (and what isn’t), you understand customer preferences and gain valuable insight that informs upcoming strategies.
Taking swift action:
In this perpetually shifting environment, acting quickly has never mattered more. Once you are sure you have discovered an insight, hold focus groups to explore all the ways in which you might apply it to the customer journey. Acting quickly to insights reinforces a positive customer experience, fostering loyalty and keeping customers where they might once have gone elsewhere.
Trusting the data:
Sometimes, data tells a story that feels counterintuitive to what you believe. While you should rightly put everything through a sense check (ensuring no obvious errors have occurred within the data-collection process that has led to an anomaly), you should also make sure you’re not cherry-picking data to fit with a preconceived narrative. Well-collected and analysed data is always more reliable for informing positive outcomes than intuition alone – don’t fall into this trap!
Lead qualification:
Embedded analytics and AI are incredibly helpful tools when it comes to analysing data in quick time. Automating lead qualification accomplishes a once laborious task with minimal effort and maximum efficiency. This not only benefits your business; it means your customers are receiving the attention and care they are used to as part of your rich customer journey.
Communicating Discoveries
If you’re not an analyst, looking at data tables can be simultaneously exhausting and confusing. If you are the analyst, the onus is on you to tell the story in a way others can understand easily.
Whether you’re communicating your findings to colleagues or customers, being creative with how you tell the data story hugely influences stakeholder engagement. The psychological power of storytelling can be traced back to paintings on cave walls.
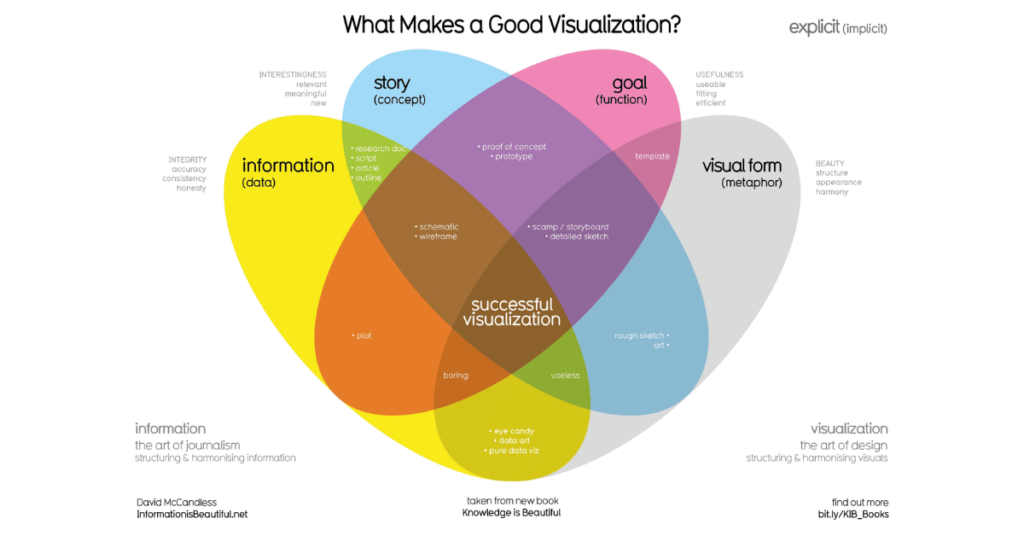
According to data journalist and information designer, David McCandles, there are 4 main elements to excellent data visualisations:
Information (data)
Story (concept)
Goal (function)
Visual form (metaphor)
However you choose to communicate your data, make sure it’s staying true to the story the data is telling. Visualisation isn’t only useful for your teams, it’s invaluable for your customers – show them what is driving their options, with visuals they can understand.
Data Insights at Eligible
As a responsive consumer platform, Eligible analyses consumer financial and behavioural data in real-time, making sure customers have what they need when they need it to facilitate good outcomes.
With sophisticated reporting options and exclusive insights from aggregated data of over 1 million end-users, we’re revolutionising customer journeys for financial institutions all over the UK.
Get in touch to book your demo and start turning your insights into actions ahead of the Consumer Duty deadline.
Ready to see how Eligible can drive growth for you? Book a tour and we'll be in touch asap.
We use cookies and similar technologies to recognise your repeat visits and preferences, as well as to measure the effectiveness of campaigns and analyse traffic. To learn more about cookies, including how to disable them, view our Cookie Policy. By clicking “Accept” on this banner you consent to the use of cookies unless you have disabled them.